I have talked a lot about a potential Uranium bull market in the making. I put my money where my mouth is as it looked like a great Uranium buying opportunity was at hand. Then the facts changed. The chart technicals deteriorated dramatically. I then had to change my mind and sold. I simply listened to the charts and didn’t stubbornly stick to my opinions.
Today I decided to have a closer look at the technicals of NYSE listed CCJ / CCO.TO – Cameco Corp., the bellwether stock in the Uranium sector.
As goes the leaders, so goes the market.
The famous market adage certainly applies when analyzing individual sectors. Cameco is the undisputed leader sporting the highest market cap within the Uranium realm. If CCJ breaks down the rest of the pack will follow.
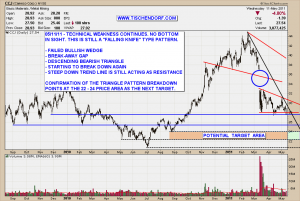
Click on the chart to enlarge.
The CCJ chart is not part of my public list but you can refer to DNN – Denison Mines which looks very similar and the various Uranium Sector Overview Charts. The CCJ chart is sending a pretty clear signal. What started with a very strong new up trend morphed into a bullish wedge consolidation pattern which was ultimately resolved to the downside after the Fukushima catastrophe hit the wires. The gap down has the potential to be a break-away gap. That would imply the down move is not over yet. The current bearish triangle consolidation pattern is now threatening to be resolved to the downside. Actually the stock has already started to break down from that pattern. Follow through and a bit more downside confirmation will give us technical price targets in the 22 – 24 USD$ price area. So far the steep black downtrend line I drew into the chart is acting as resistance. As long as price gets rejected from that trendline the path of least resistance is down.
To make a long story short, from a purely technical perspective we are witnessing a ‘falling knife pattern’. If you are a technical trader you have no business catching falling knives. Patiently wait for selling exhaustion to hit. Patiently wait for the charts to set up again. Keep in mind we are now dealing with a situation where overhead resistance is playing an important role. I want to remind you of the fact that overhead resistance is the number one performance killer. Traders holding positions will be fighting against massive selling pressure as those who got trapped will actively seek to sell for a break even trade whenever the stock tries to move up.
Conclusion:
The Uranium charts are broken. Don’t be a hero. If you initiate positions keep in mind you are fighting a strong downtrend and an overhead resistance situation.
A speculator is one who runs risks of which he is aware and an investor is one who runs risks of which he is unaware. – John Maynard Keynes
My public list with all my charts can be viewed here:
http://stockcharts.com/def/servlet/Favorites.CServlet?obj=ID2791469
Buenas noches!

{ 1 trackback }
Comments on this entry are closed.