The insurance software stock EBIX – Ebix.com Inc. was recently highlighted for members as a ‘High Potential Stock’. It displays several character traits that are typical for big winning stocks in the making.
In my videos that I produce exclusively for members, you get to know what these winning character traits are. Join the Tischendorf Letter Premium to learn how to spot big winners early on: https://members.tischendorf.com
One such character trait is obviously related to price. You can spot big future winners by scanning for stocks making new 52 week highs or new all time highs. EBIX fits that description.
Information a look at a pure price chart doesn’t reveal is the short interest. With EBIX, the short interest is simply mind-boggling. More than 30% of the current float has been shorted. Interestingly, EBIX features additional big winning stock character traits, but still, traders are in denial and shorting the stock like there’s no tomorrow.
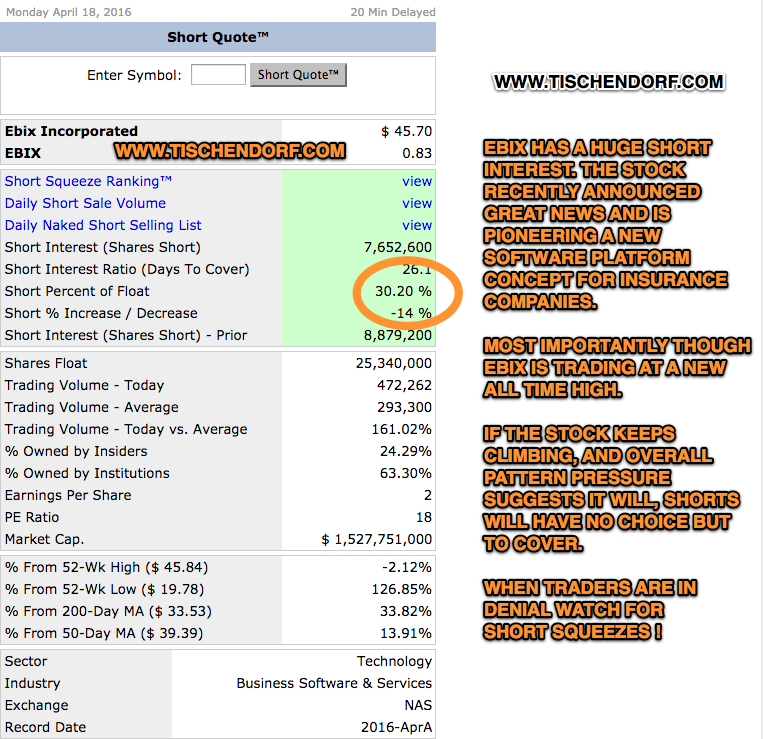
This often represents a great trading opportunity. If the stock continues to creep higher and keeps printing new all time highs, at some point in time the pressure on shorts will become unbearable. When they start to cover in earnest, everyone will rush to the exit at the same time. If we get a ‘throwing in the towel’ situation, this will be the start of a big short squeeze.
As you can see in the chart below EBIX – Ebix.com offers excellent overall pattern pressure.
Click on EBIX – Ebix.com Inc. chart to enlarge:

Momentum traders and technical traders buying new all time highs are already adding fuel to the fire.
Update 04/19/16:
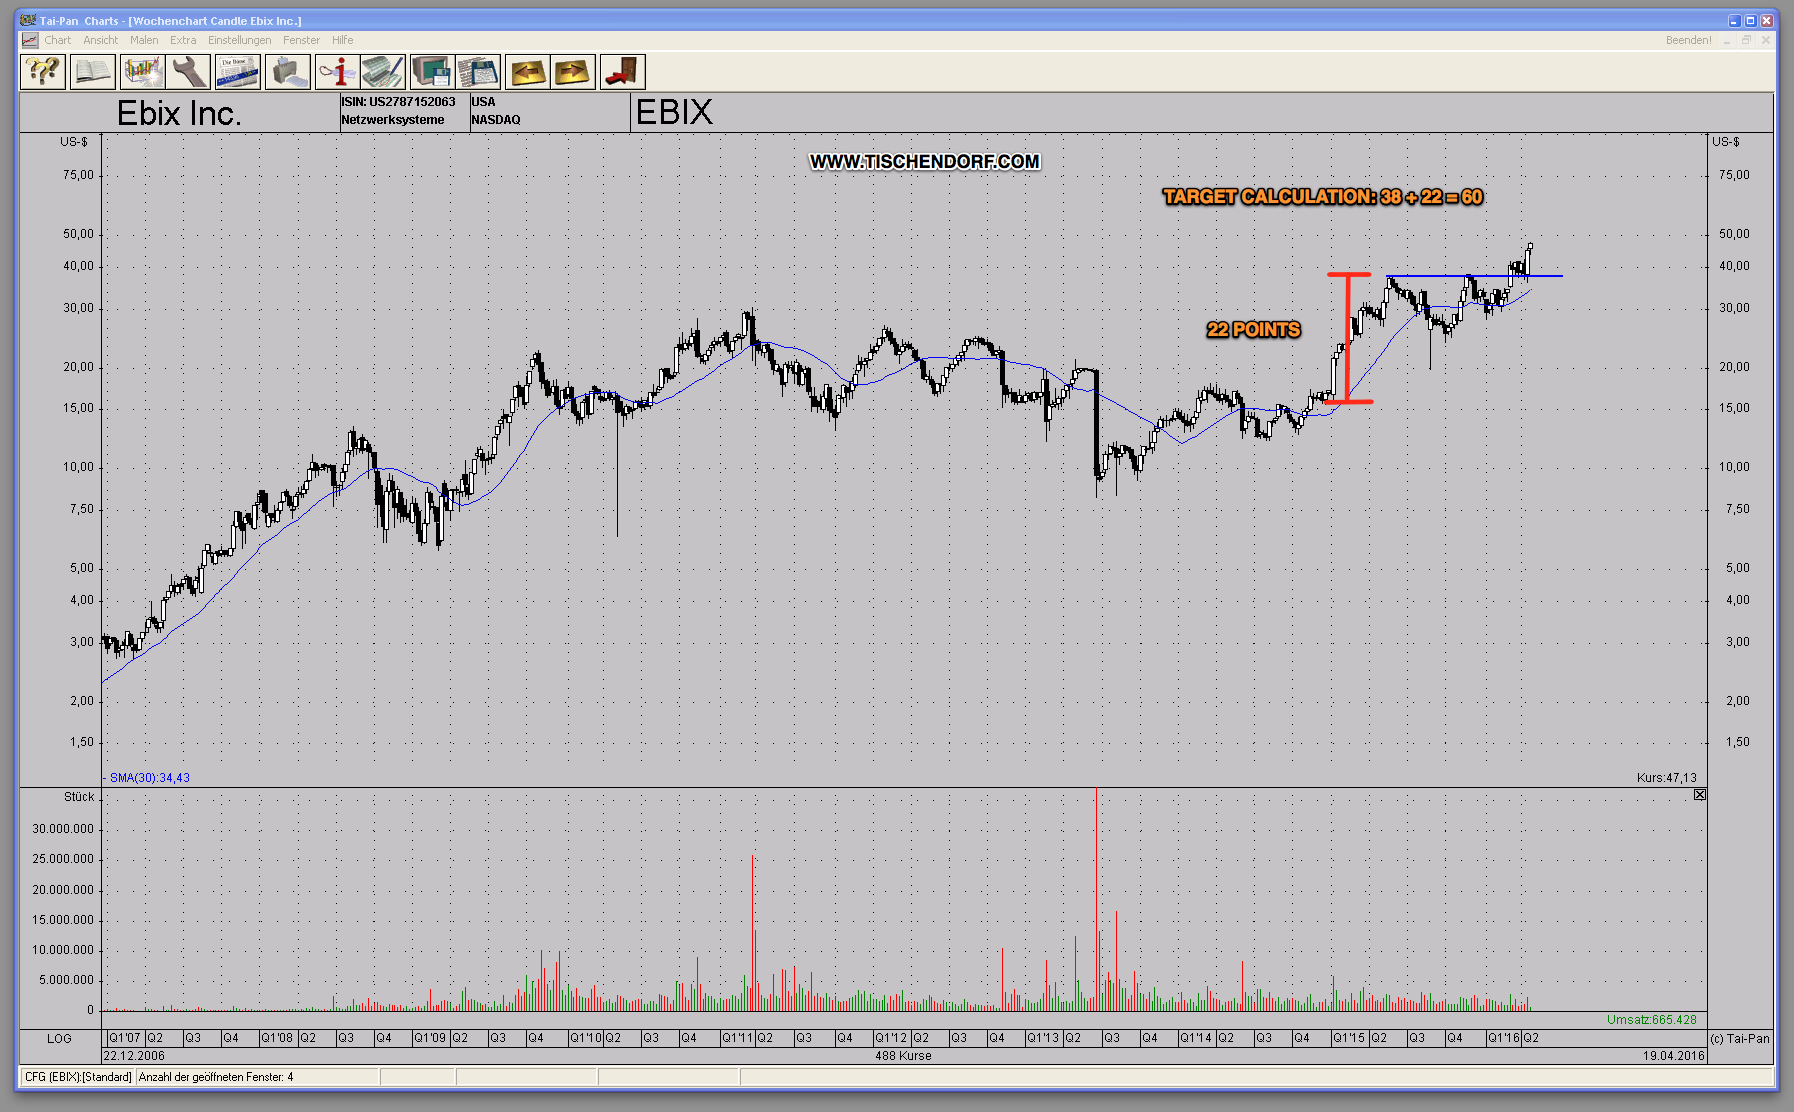
EBIX has started to run higher and is now most likely on its way toward a ‘Conservative technical price target of $60′. The chart below shows how I use technical analysis principles in order to calculate a purely technical price target. I compressed the chart, that way the formations and the dominant chart patterns are much easier to identify.
Click on EBIX – Ebix.com price target chart to enlarge:
In my method of trading I buy after a stock makes a new high. – Jesse Livermore
—> http://bit.ly/1i24j40
Join the Tischendorf Letter Premium, learn ‘How to think as a Trader’ and get exposure to New Market Leaders!