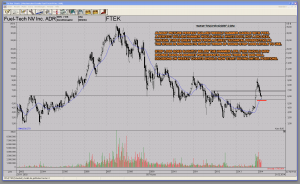
Quick chart update for FTEK – Fuel-Tech a position I initiated this week. The weekly chart is now displaying an almost picture perfect bullish hammer candle pattern. As outlined in my chart annotations a picture perfect hammer candlestick would tend to have a white body on top of a long tail / wick / shadow. This is no big deal though. The important factors regarding a hammer’s bullishness are the following:
- The tail should be rather long
- The hammer should only appear AFTER a protracted decline
- Ideally the hammer, body or tail, hits an area of multiple support
- The body should be small. Either white or black. White being slightly better.
Conclusion: FTEK is showing its hand. Market participants basing their buy and sell decisions on weekly charts should now start buying into the stock. The best part though is the clues the low of the weekly candle is giving us. The low shouldn’t be breached. A stop loss therefore should be placed slightly below that price level.
Hat tip to Finance Trends for digging up the following quote a while back:
Honesty, ethics and humility are much more important qualifications for the successful investor than a big ego or high IQ. – William O’Neill
Twitter: https://twitter.com/tischendorf
Investing in your education always pays. Learn how to read chart patterns like a pro! Tischendorf Letter Premium: https://members.tischendorf.com
