As I just posted on Twitter, I am very pleased with my summer break timing. I kept almost all of this year’s profit, protected precious mental capital and recharged my batteries. The past two weeks I’ve gone through lots of charts and have rebuilt my watch list. To be more precise, I usually run a very extensive watch list containing roughly 400 stocks. Most of those are now technically broken and have accumulated serious Overhead Resistance.
In order to be successful in the markets one needs to continually adapt to change. That includes letting go of stocks and focusing on new stocks that emerge. This simply means no emotional attachment to stocks, no strong opinions and a ‘flow state of mind’ approach. Stocks that deserve my attention need to prove themselves. That means they need to pop up in my technical scans. Then they earn the right to be added to my various watch lists. The stocks that roll over, gap down hard and show lots of weakness are thrown out. No hard feelings. On to the charts:
WK – Workiva click on chart to enlarge:
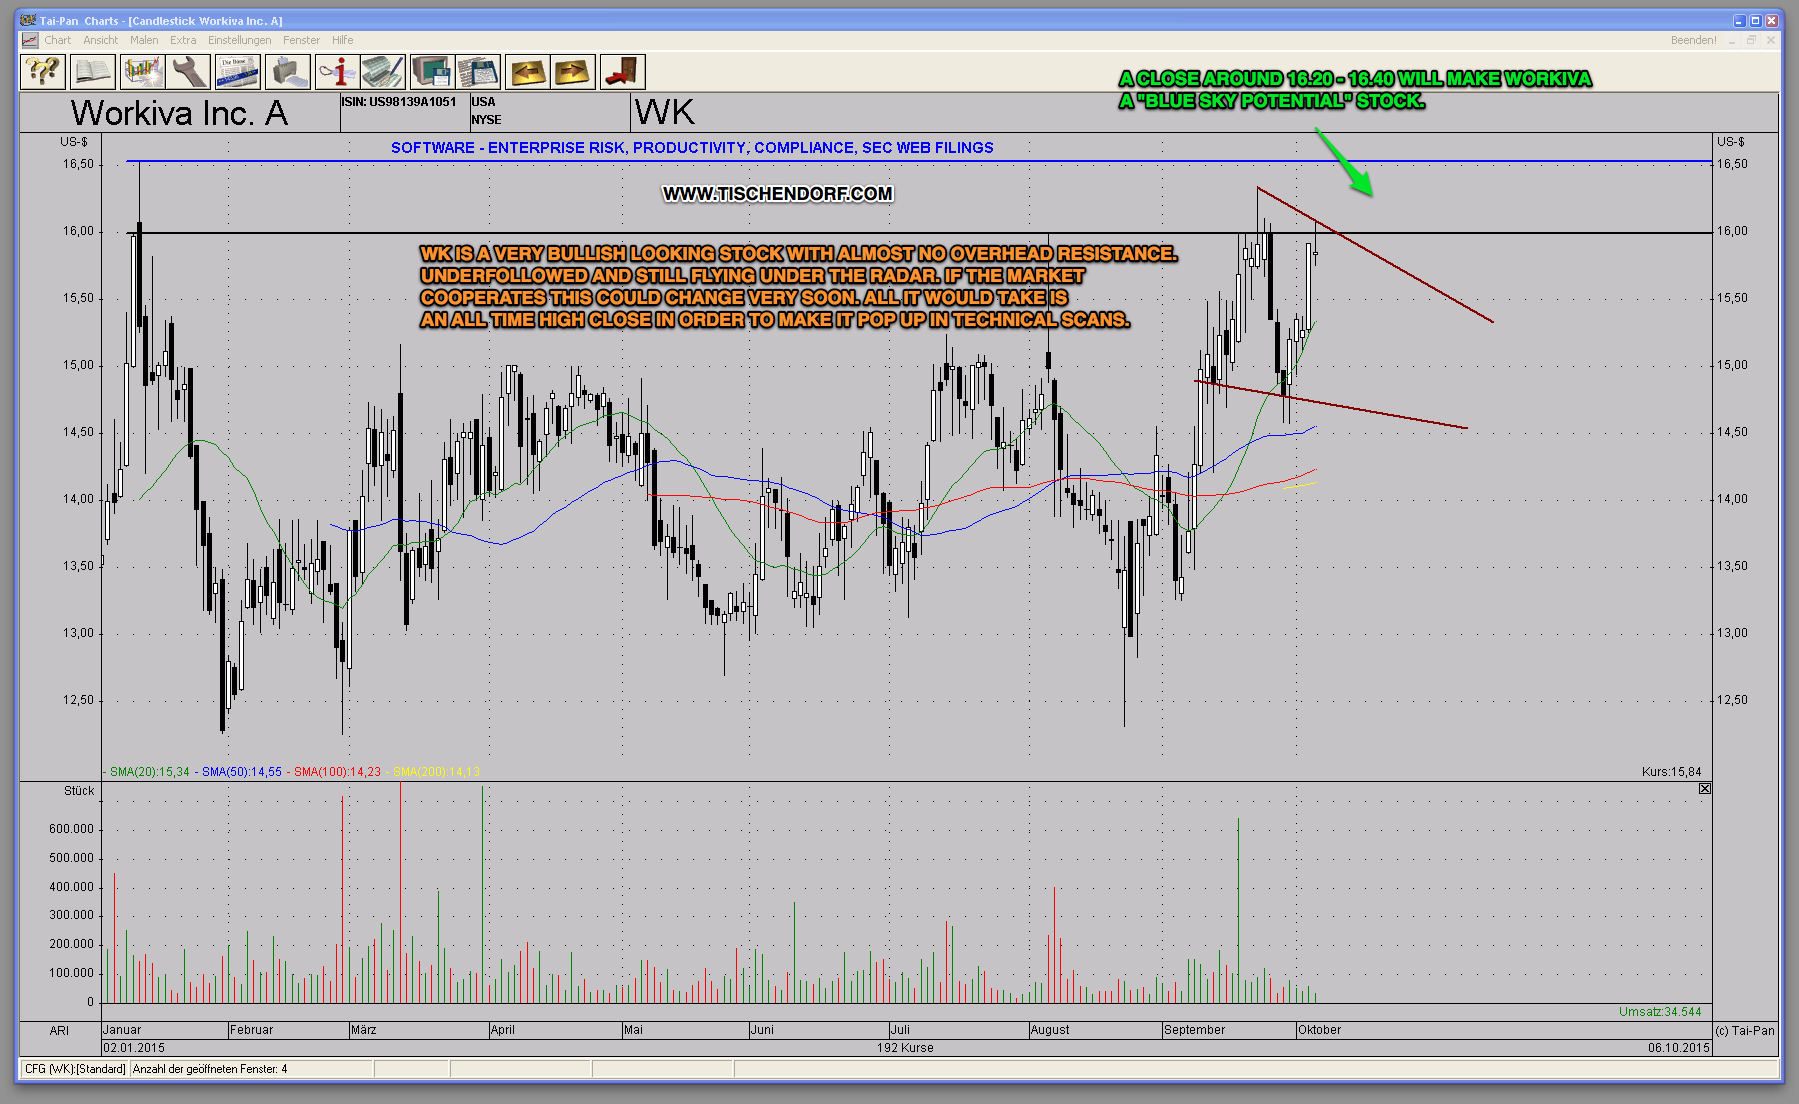
As you can see in my chart annotations, WK – Workiva is trading very close to its all time high. The stock is flying under the radar and is completely underfollowed. In order for the stock to develop into a big winner that obviously has to change. The odds are great though. All it would take would be an all time high close which is only cents away. The stock would then pop up in various technical scans and generate interest with technical traders.
MXL – MaxLinear click on chart to enlarge:
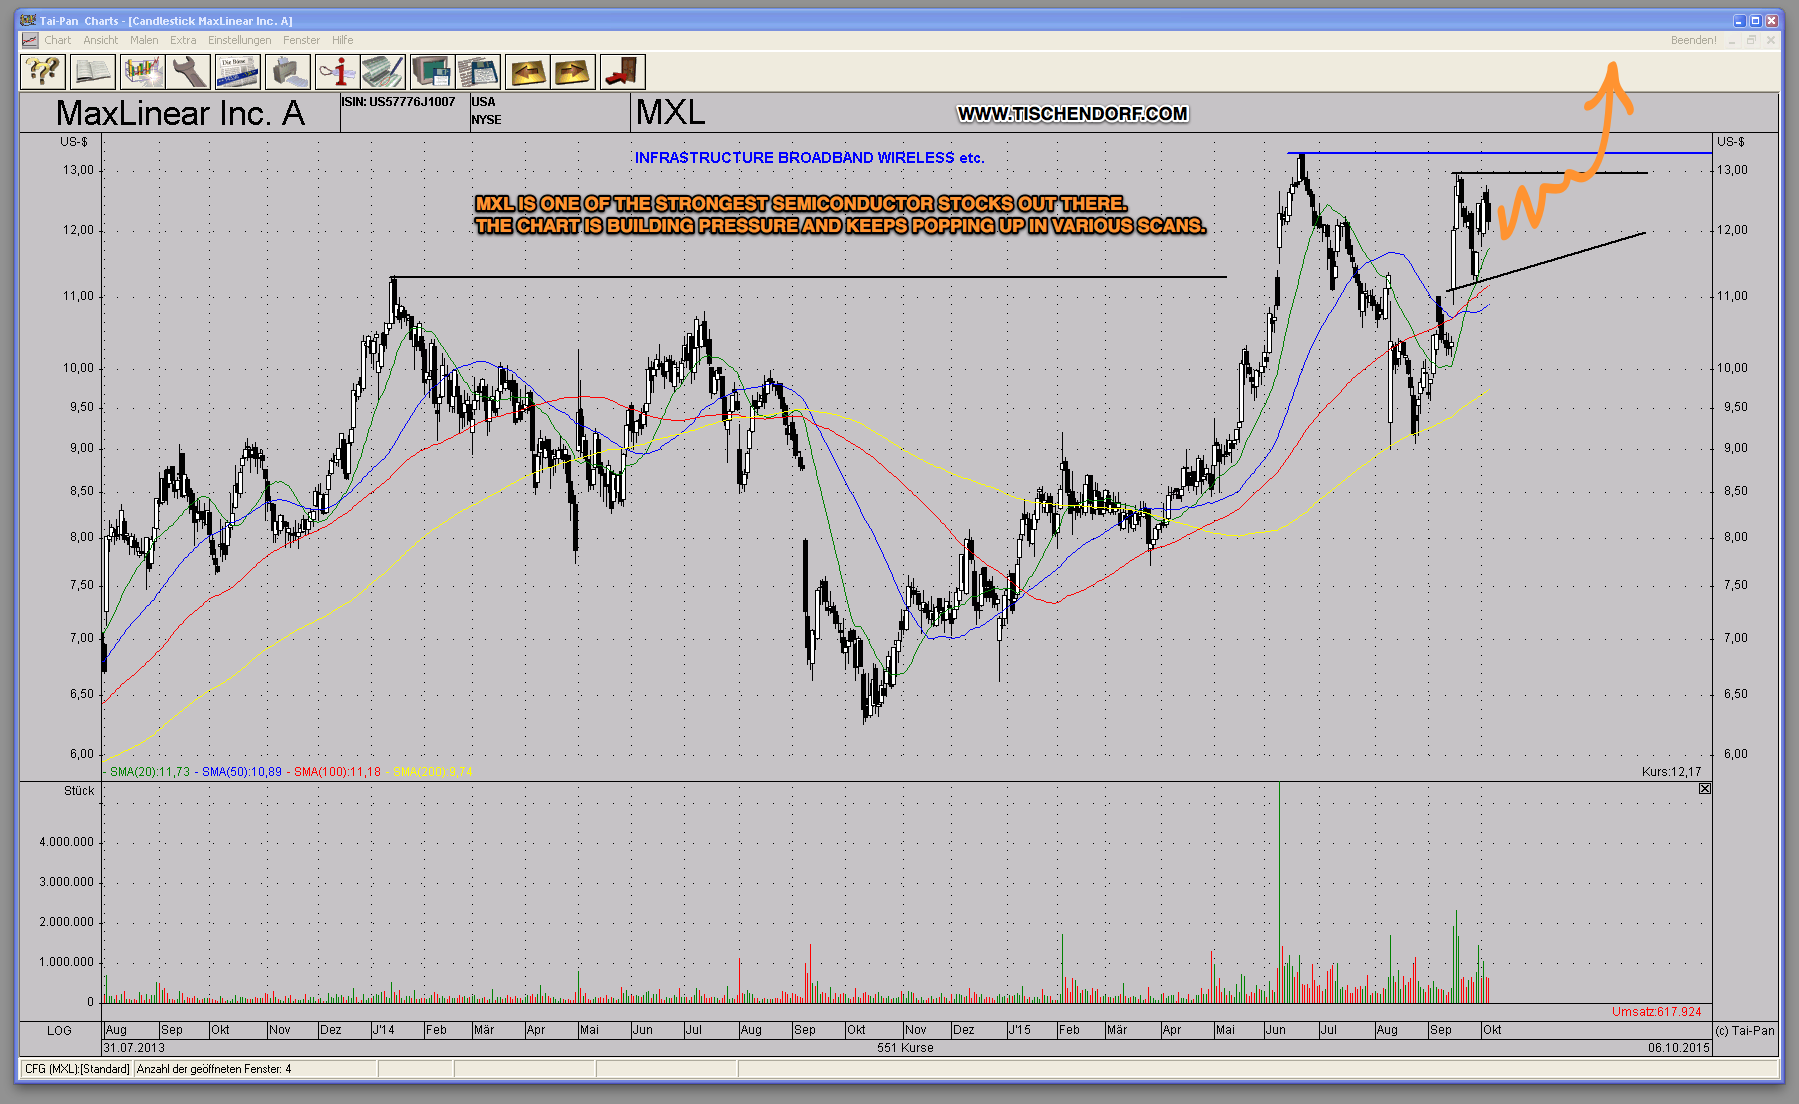
The chart is building up pressure. If the market cooperates MXL looks like it could develop into a big winning stock. It keeps popping up in several of my scans. One of the most constructive and bullish semiconductor charts out there.
IPHI – Inphi click on chart to enlarge:
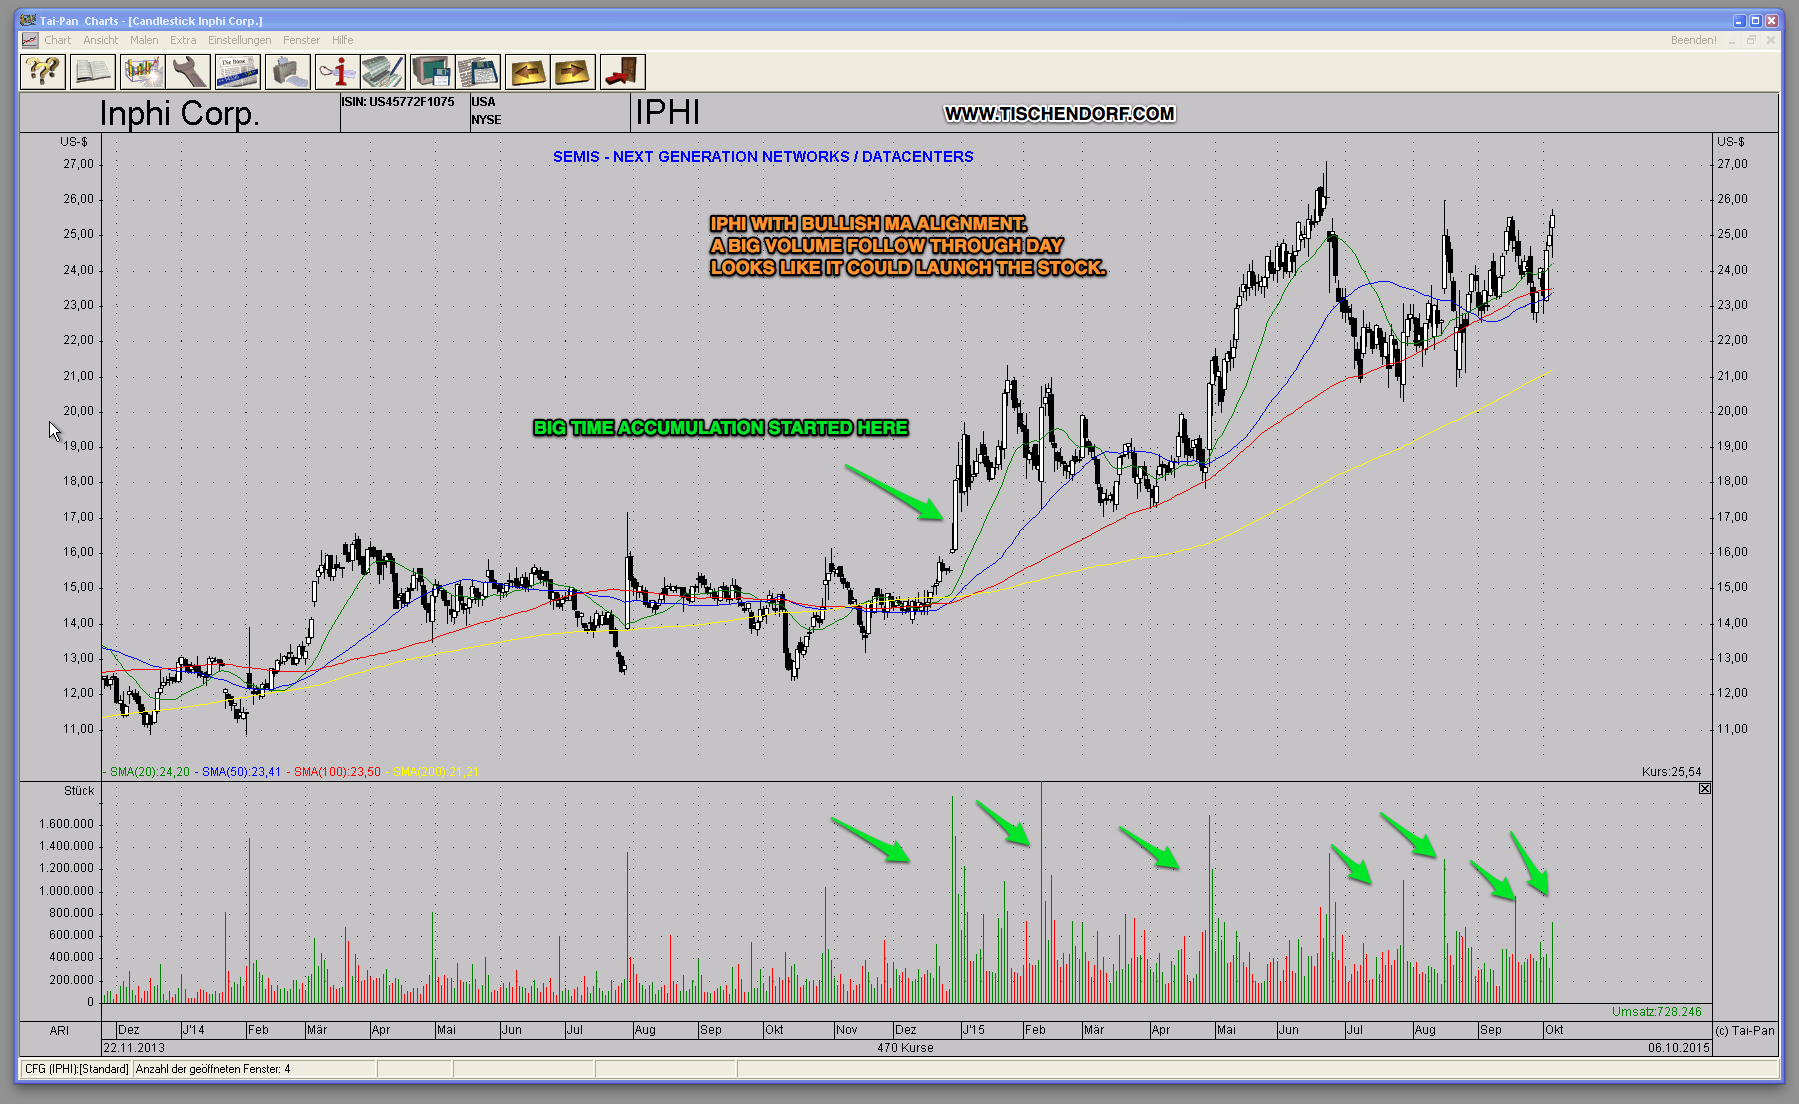
IPHI is displaying a consistent bullish volume accumulation pattern. There is almost no overhead resistance. If the market cooperates this is the type of set-up that could launch the stock.
Conclusion: The market environment is far from optimal. As a trader my job is to constantly monitor the market and be prepared and ready when the market again rewards aggressive trading. Technically speaking, the stocks I highlighted above are potential winners during optimal market environments. The key here is to get some exposure and see if the market rewards these test buys. If it does, I will gradually increase exposure. If it doesn’t, I decrease exposure and patiently wait for better set-ups.
The real test of a market’s weakness is not on the decline, but on the advance following the decline. – Kevin Marder
Twitter: https://twitter.com/Tischendorf
Investing in your education always pays. Learn how to read chart patterns like a pro! Tischendorf Letter Premium: https://members.tischendorf.com