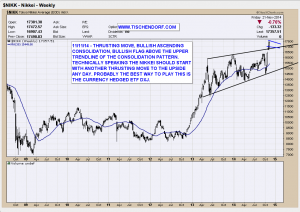
After doing a bullish chart analysis of DXJ the currency hedged Japan ETF I decided to add the Nikkei Index to my public chart list. Here’s a quick 2 minute video explaining the ABC move concept I talk about so often:
An initial thrusting move, followed by a consolidation pattern and the resumption of the trend leading into the pattern. In the video I also show how to derive a technical price target for the Nikkei.
Here’s the Nikkei chart I just added to my public list. Click to enlarge:
Always up-to-date Nikkei 225 chart on my public list.
https://www.youtube.com/watch?v=rpQrzJM8zEs
For those who read my website via RSS or email website updates, click the link above to watch the video. Hope you like it!
Risk takers never complain. They do. – Nassim Nicholas Taleb
Twitter: https://twitter.com/Tischendorf
Investing in your education always pays. Learn how to read chart patterns like a pro! Tischendorf Letter Premium: https://members.tischendorf.com
